Part 9 of the DevOps Dirty Dozen Series: Falsus in uno, falsus in omnibus — false in one thing, false in all.
Insight: Warns against misleading metrics that distort the truth.
Metrics are supposed to help teams see reality more clearly. Used well, they reveal bottlenecks, validate improvement, and help engineering organizations make better decisions. Used poorly, they become theater.
The danger is not measurement itself. The danger is measuring what is easy, rewarding what is visible, and mistaking activity for progress. A dashboard can be full and still tell the wrong story. A team can improve every reported metric while the system becomes harder to operate.
Metrics misuse is what happens when numbers stop informing judgment and start replacing it.

A dashboard can be green and still be lying to you.
The Anatomy Of Metrics Misuse
Bad metrics usually do not look bad at first. They are tidy, countable, and easy to report upward. That is what makes them dangerous.
Common patterns include:
-
Activity Metrics Disguised As Outcome Metrics: Counting commits, tickets closed, story points completed, or pipelines executed can describe motion. It does not prove customer value, reliability, or delivery improvement.
-
Vanity Dashboards: Charts are built because the data is available, not because the team knows what decision the chart should support. The dashboard becomes decoration.
-
Metric Gaming: Once a metric becomes a performance target, people adapt to the metric. If teams are rewarded for closing tickets, tickets get smaller. If they are rewarded for deployment count, deployments may increase without improving outcomes.
-
Averages That Hide Pain: Average latency, average resolution time, and average failure rate often hide the worst user experience. Averages are comfortable. Tail behavior is where users suffer.
-
Single-Metric Management: Leadership picks one metric and optimizes aggressively. Deployment frequency goes up while change failure rate worsens. MTTR improves because teams roll forward without fixing root causes. The system optimizes locally and degrades globally.
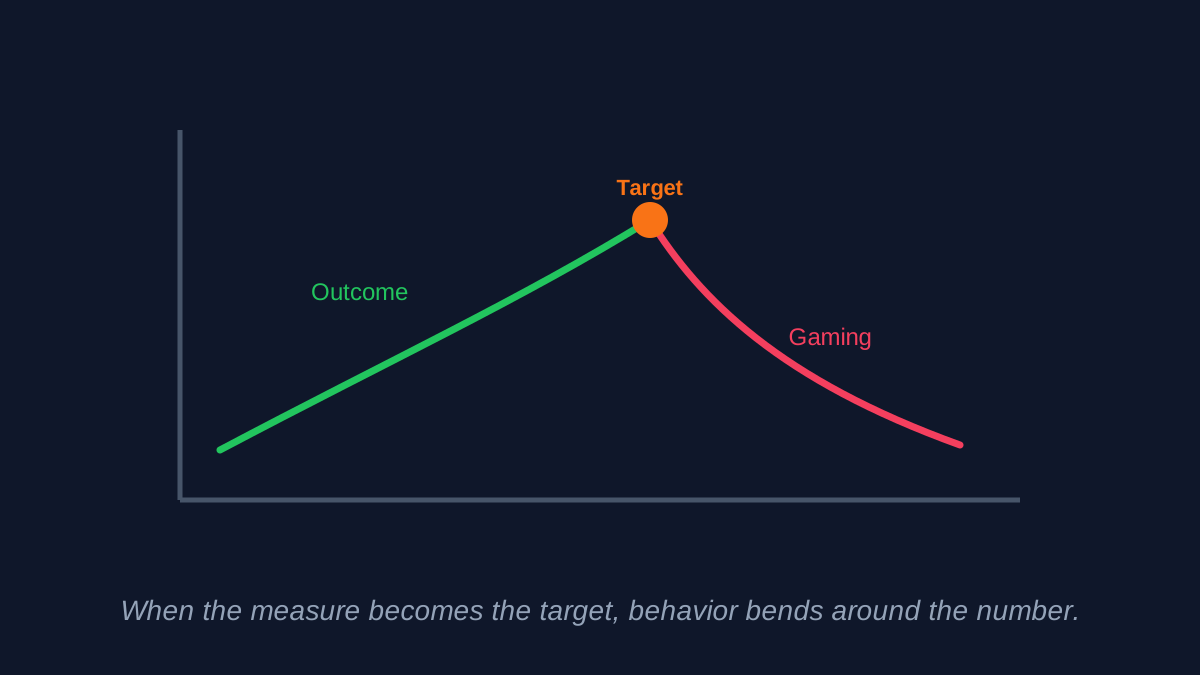
When the measure becomes the target, behavior bends around the number.
The Cost Of Bad Metrics
Misused metrics do more than waste reporting time. They actively reshape behavior.
-
Teams Optimize For Appearance: If the metric rewards visible activity, teams produce visible activity. The organization gets more motion and less learning.
-
Real Risks Stay Hidden: A team can hit sprint targets while reliability declines. A platform can show high deployment frequency while rollback paths are broken. Bad metrics create false confidence.
-
Psychological Safety Erodes: When metrics are used as weapons, engineers hide bad news. Incidents are softened. Estimates are padded. The data becomes less truthful because the organization made truth unsafe.
-
Decision Quality Declines: Leaders make resource decisions based on distorted signals. The team with the best reporting looks healthiest, even if the most important work is happening elsewhere.
-
Continuous Improvement Stalls: Improvement requires honest feedback. If the measurement system rewards performance theater, the feedback loop is corrupted.
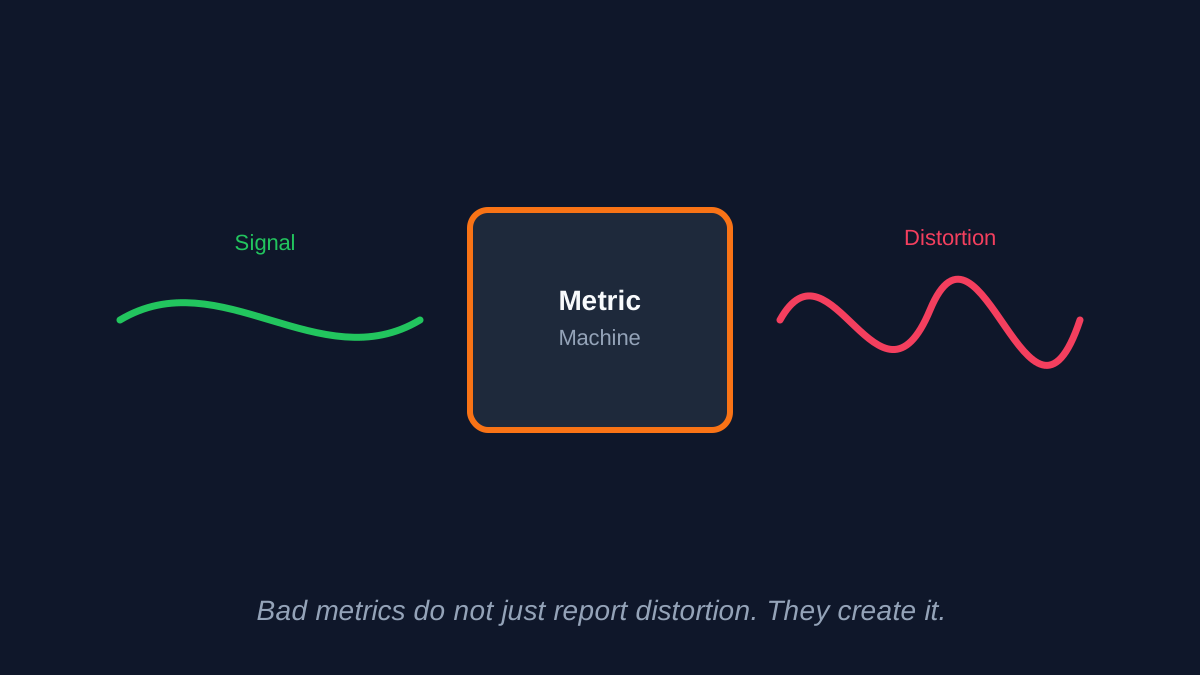
Bad metrics do not just report distortion. They create it.
A Real-World Example: The Ticket Closure Trap
One operations team I worked with was measured heavily on weekly ticket closure count. On paper, the numbers improved. Backlog volume went down. Reports looked better. Leadership saw momentum.
But the team had changed its behavior to satisfy the metric. Large recurring problems were split into small tickets. Tickets were closed when a workaround was applied, not when the underlying issue was resolved. Follow-up work moved into chat threads where it no longer counted against backlog. The metric improved while the operational reality got worse.
The signal eventually surfaced during incident review. Several outages traced back to the same unresolved automation failure. The tickets had all been closed. The problem had never been fixed.
The metric was not useless. Ticket closure can be a helpful operational signal. The misuse was treating closure count as a proxy for reliability. The better question was not “How many tickets did we close?” It was “How many recurring causes did we eliminate?”
Meaningful Metrics Versus Vanity Metrics
Useful metrics connect to outcomes and decisions. Vanity metrics make teams feel productive without forcing a useful choice.
| Vanity Metric | Better Question |
|---|---|
| Number of commits | Did the change improve customer or operational outcomes? |
| Story points completed | Did lead time improve without increasing failure rate? |
| Tickets closed | Did recurring causes decrease? |
| Number of dashboards | Which dashboard changed a decision? |
| Alert count | Which alerts are actionable and reduce time to detect? |
| Test count | What failure modes are covered and what escaped? |
| Deployment count alone | Are deployments safe, reversible, and low-risk? |
This does not mean activity metrics have no value. They can be useful diagnostic signals. The mistake is promoting them into success measures without context.
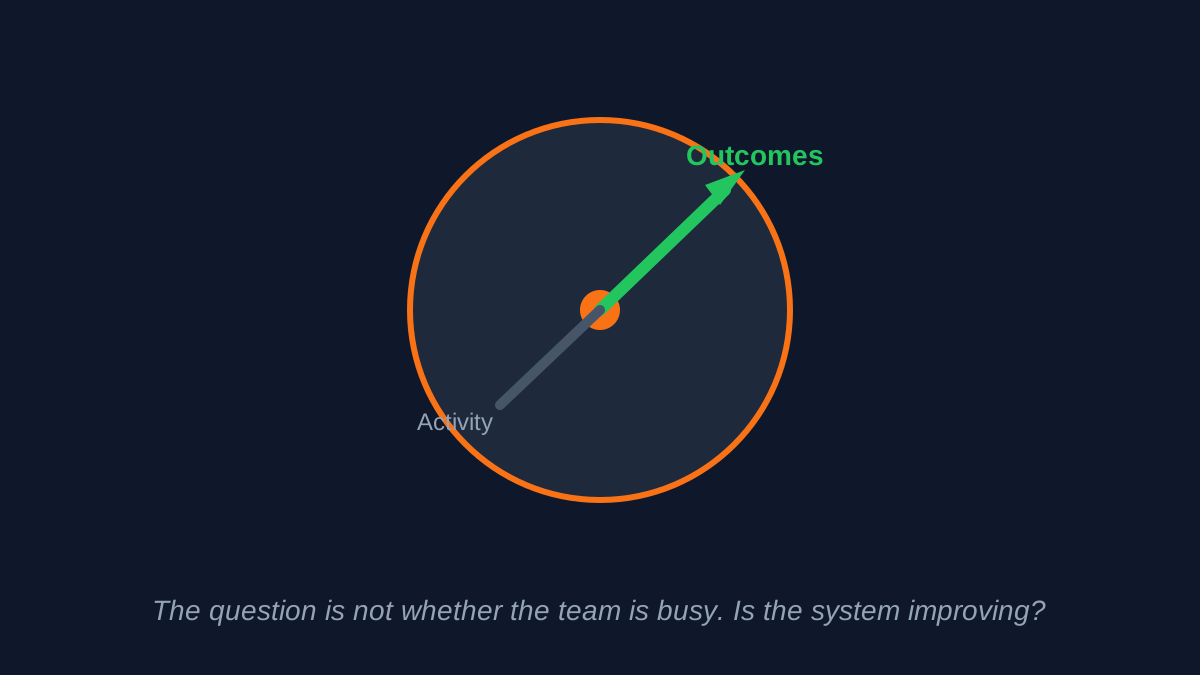
The question is not whether the team is busy. The question is whether the system is improving.
Choosing Metrics That Improve Behavior
Metrics should help teams improve the system, not perform for the dashboard.
-
Start With A Decision: Before adding a metric, ask: “What decision will this help us make?” If there is no decision, there may not be a reason to measure it.
-
Pair Speed With Safety: Deployment frequency without change failure rate is incomplete. Lead time without quality is incomplete. MTTR without recurrence is incomplete. Metrics need balancing pairs.
-
Measure Trends, Not Just Targets: A single number can be gamed or misunderstood. Trends reveal direction. Direction matters more than the snapshot.
-
Use Percentiles For User Experience: Averages hide pain. For latency and reliability, look at p95, p99, error budgets, and user-impacting failure modes.
-
Make Metrics Team-Owned: Metrics should be tools for the team closest to the work. When metrics are imposed only for executive reporting, they drift toward performance theater.
-
Review Metrics For Harm: Ask whether a metric encourages bad behavior. If it does, change it. A metric that damages judgment is worse than no metric.
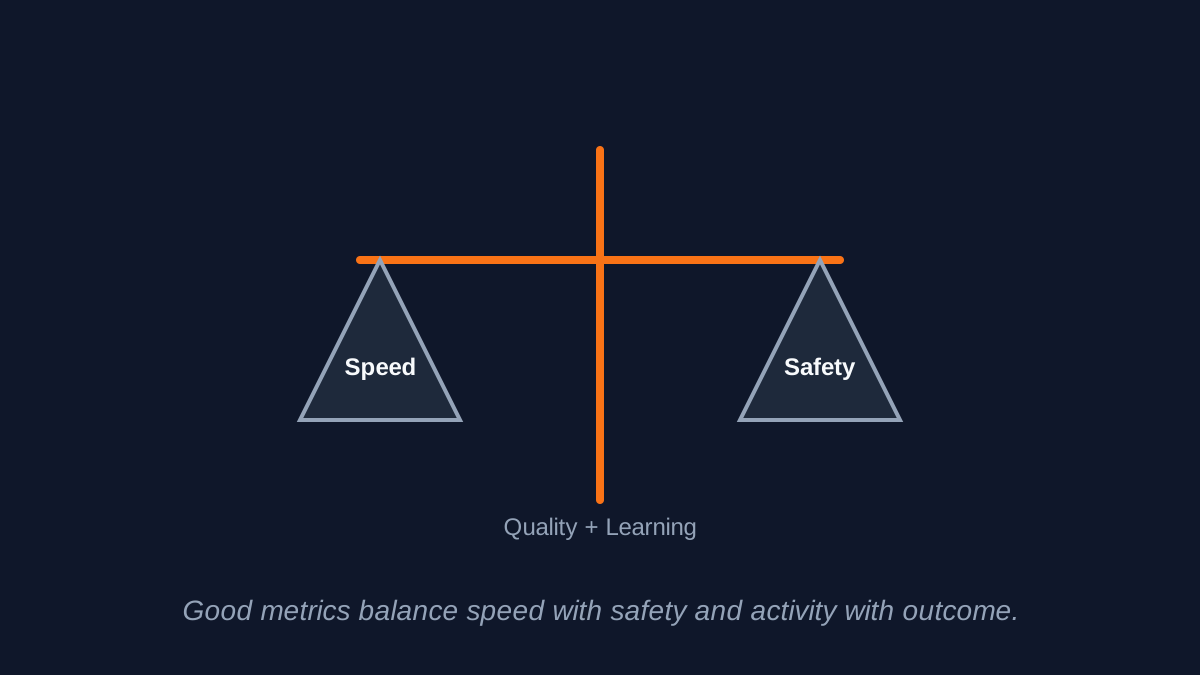
Good metrics balance speed with safety, activity with outcome, and delivery with learning.
Applying The Scientific Method
Metrics are hypotheses about what matters. Treat them that way.
-
Ask: What outcome are we trying to improve?
-
Hypothesize: “If we reduce lead time while keeping change failure rate stable, users will receive value sooner without reliability loss.”
-
Measure: Select metrics that test the hypothesis, not metrics that merely describe activity.
-
Observe: Watch for intended and unintended behavior changes. Are teams improving the system or gaming the score?
-
Revise: Retire metrics that no longer help. A metric can be useful for a season and harmful later.
Carl Sagan’s Baloney Detection Kit
When reviewing a metric, challenge it directly:
-
“What does this actually prove?” — Does the metric connect to user value, reliability, flow, or learning?
-
“What behavior does this reward?” — If people optimize for the number, will the system improve or merely look better?
-
“What does this hide?” — Are averages hiding outliers? Are success rates hiding degraded users? Are closed tickets hiding unresolved causes?
-
“Can this be gamed?” — If yes, assume it eventually will be, even unintentionally.
-
“What metric balances this one?” — Speed needs safety. Output needs quality. Recovery time needs recurrence rate.
A metric should reflect reality, not flatter the organization.
Moving Forward Together
Metrics are powerful because they focus attention. That is also why they are dangerous. The wrong metric does not simply mislead leadership; it teaches teams what the organization actually values.
If the organization values closed tickets, it will get closed tickets. If it values deployment count, it will get deployments. If it values learning, safety, and customer outcomes, the metrics should make those things visible.
The goal is not to measure everything. The goal is to measure honestly enough that teams can improve without fear and leaders can make decisions without illusion.
What number does your organization celebrate that might be hiding the real problem? What would happen if that metric disappeared tomorrow?
References
- Accelerate: The Science of Lean Software and DevOps by Nicole Forsgren, Jez Humble, and Gene Kim
- The DevOps Handbook by Gene Kim, Patrick Debois, John Willis, and Jez Humble
- Google SRE Book — Service Level Objectives
- Google SRE Workbook — Implementing SLOs
- Goodhart’s Law
- DORA Research Program
- DORA: Generative organizational culture